David Michael Ross wrote a blog post, Sorry, Geeks, Microsoft Excel is Everywhere, which is a spectacularly poor defense of the ubiquitous use of Excel.
The blog post is a response to "software folks" (DMR declines to offer specific examples) who are "shocked" that JPMorgan used Excel to create risk models for certain portfolios.
A precis:
-
Geeks are shocked that people are using Excel for things, but they shouldn't be. (First section)
-
Spreadsheets began with VisiCalc and Lotus 123 and have been popular for a long time. ("Birth of the spreadsheet")
-
Excel is basically just agile development for business management. ("The business world runs on Excel")
-
Excel can be used for other things too, such as UI wireframes, attaching screenshots to emails, and making numbers line up. ("It’s not just a spreadsheet")
-
Excel itself never contributes to or causes any problems, and these problems can be easily solved by using better tools. ("What can we do about it?" and "Don’t hate the spreadsheet, hate the game.")
Whether because of laziness or simply because he hasn't been exposed to well-written criticism, DMR demonstrates a very poor understanding of the opposition to Excel's misapplication in the business world.
He writes,
"Software folks are shocked that so much wealth was entrusted to a simulation written by an amateur with a spreadsheet program. But they shouldn’t be surprised, because that’s how it’s been for years."
He seems to think this is a simple case of "geek prejudice," and tries to plead his argument accordingly, with the preachy history lesson and so forth.
I don't know if DMR has read The Importance of Excel by James Kwak (I kind of hope not, because if so, he has even less excuse for mischaracterizing the issue as he has done).
If he had, he would see, alongside a realistic assessment of Excel's ubiquity in the business world (no "shock" here), a very detailed list of Excel's weaknesses that DMR addresses nowhere:
- Data flows are untraceable
- There’s no audit trail -- you can overtype numbers and even complex formulas and see no indication of your mistake
- Excel spreadsheets are untestable
- Copying and pasting data to and from spreadsheets (as in the case of JPMorgan) introduces points of failure which are unnecessary and difficult to detect.
DMR fails to observe any distinction between prototyping and operational uses for spreadsheets. Spreadsheets work great for prototyping (although they still foster silent-error creep when used for complex models), and suck at operations when compared to suitable tools such as accounting software.
DMR writes, "We live in a wonderful time when programmers can be so naive about the workings of Big Business."
Personally, I'm a programmer who's also been a business manager for eight years. I've used both Excel and professional accounting software (i.e., not QuickBooks, although QuickBooks is fine), and I can tell you: when I used Excel for operations (vs prototyping), it was because I had to. Excel can stand in for deficiencies in your accounting software, in a pinch. But it always requires vastly more effort to reliably perform the same reporting tasks in a spreadsheet.
As Jame Kwak points out in his post, spreadsheets are inherently fragile and unreliable. They need to be groomed and double-checked constantly in order to ensure you're getting correct results. Mistakes can be very easily introduced and easily remain undetected. The constant tradeoff is between spending a great deal of man-hours maintaining the spreadsheet, or in delivering reports with errors. (The JPMorgan debacle illustrates this perfectly.)
Contrast this with accounting software, which has reliable data models, automated ways of querying and summing data, and built-in checks for everything. If given the choice, I would always prefer to use accounting software for operations: the computer does far more of the work for you, and is constantly validating your input and keeping an audit trail.
To put it succinctly, "software people" aren't opposed to the use of Excel for operations out of small-minded prejudice. They're opposed because they're intimately familiar with the problem space and aware that far better alternatives exist.
And they're not at all opposed to the use of spreadsheets for quick-and-dirty prototyping.
DMR has "seen Excel used in amazing ways."
-
"I’ve also seen people sit down with a calculator and compute cell values themselves, blissfully unaware that the software could do it for them. Excel is a tool for lining up numbers."
-
"I’ve seen an application’s configuration managed by tweaking a CSV file in Excel and uploading it to a server. Excel is a tool for separating labels from values."
-
"I’ve had screenshots pasted into Excel and attached to an email. Excel is an ubiquitous file format."
-
"I’ve received an entire application wireframed by the accounting department, with each screen drawn with filled-in ASCII-art columns on its own worksheet and every button hyperlinked to a worksheet showing the next application state."
This reads like a parody. I'm sure I can come up with a hundred wacky uses for a hammer -- use the claw as a chisel! use it to press the buttons on your dishwasher! But such a list is really just an ironic illustration of 1) the fact that the hammer has only one suitable function, and 2) the various forms that stupidity can take when this truth is ignored.
DMR concludes,
"Excel wasn’t the problem at JP Morgan. There was a reckless culture that thumbed its nose at rules, ignored the guidance of review committees, and tried to sweep things under the rug when they got caught. That would have happened whether the models were written in Excel or Ruby."
I would say this is a misdiagnosis.
Let's look at the specific error under review:
The new model “operated through a series of Excel spreadsheets, which had to be completed manually, by a process of copying and pasting data from one spreadsheet to another.” The internal Model Review Group identified this problem as well as a few others, but approved the model, while saying that it should be automated and another significant flaw should be fixed.** After the London Whale trade blew up, the Model Review Group discovered that the model had not been automated and found several other errors. Most spectacularly,
“After subtracting the old rate from the new rate, the spreadsheet divided by their sum instead of their average, as the modeler had intended. This error likely had the effect of muting volatility by a factor of two and of lowering the VaR . . .”
Specifically:
-
The data entry part of the Excel model was not automated as recommended by the internal reviews.
-
After catastrophe struck, the Excel model was found to have several simple mistakes in its calculations which profoundly compromised its results.
Neither of these are problems of reckless deception.
JPMorgan's own internal review mandated that they automate the inputs of Excel spreadsheets, but this is not easy to do. Cells can link to values in other spreadsheets, but although this removes a step in the maintenance process, it also makes mistakes even harder to detect, and allows them to propagate seamlessly to spreadsheets further along in the "chain." This goes to the core problem that it is impossible to build and enforce basic business logic in Excel.
The second issue is that Excel models present only results; it hides the code and the data flows behind those results. This causes two problems in practice, 1) it disincentivizes people from looking at and validating the actual code the model is based on, and 2) even if you try, you can never get a comprehensive overview of the code. You must look at it on a cell-by-cell basis, and piece together in your own head what is being used where.
No, people aren't perfect. But this is precisely the reason why our tools and processes should reinforce sound behaviour.
Suppose JPMorgan had had the same internal review process, but used a different set of tools. Could a better outcome have resulted?
Let's say that, instead of Excel, JPMorgan had used another tools instead: a simple scripting language (such as RStats)
What would have changed?
-
Everyone at every step in the writing, review, and use of the model would be able to easily review the code producing the results, which would not have been hidden behind cells in a spreadsheet. More eyeballs on the code might have caught simple calculations sooner.
-
They would have mechanisms for testing the validity and freshness of the data used, and for automatically selecting and operating on data sets from a variety of sources.
-
Eliminating manual data entry would have reduced opportunities for transcription errors.
-
Changes to the code can be meaningfully tracked and reviewed (no DMR, "saving a new version with the date tacked on the end of the filename" does not allow for meaningful comparison of changes between versions and is also not self-enforcing ).
Nokome Bentley et. al. have also written about the shortcomings of spreadsheets, and have a much more balanced approach for addressing them without taking away the useful parts of the interface:
I realized that, using the foundations already developed for stencils and the Substance editing library, we could merge the spreadsheet interface with the idea of documents that embedded code.
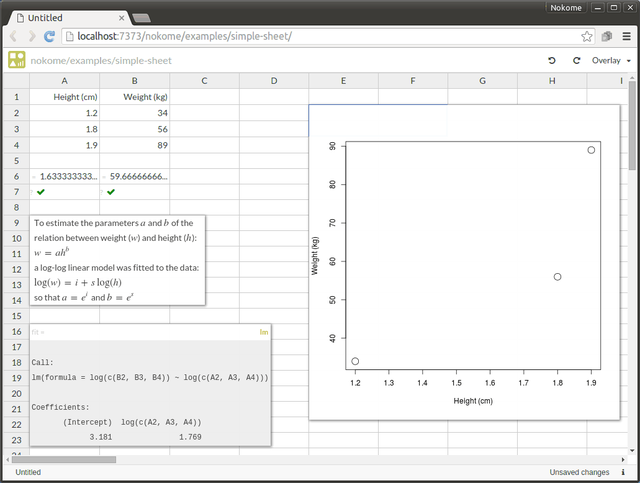
screencast example from the post Spreadsheets are dead, long live reactive programming environments!
Bentley’s/Stencila’s approach is novel in that it allows for writing tests, and for representing the sheet as plain text.
But its “code interface” is still not very good in my opinion.
- Formulas still live in cells and can still be overwritten by accident
- The text/code view of the sheet is basically spaghetti code by design — not easy to read or debug
Possible Improvements to Stencila’s Approach
Functions should not be allowed to refer to cells by their coordinates; you should be forced to “name” a cell or range of cells before referring to it in a function.
This would greatly improve the readability of the code.
Functions should not ‘live’ in cells. Function definitions should simply be part of the spreadsheet’s code .
The text-representation of the sheet would include not only a series of cell definitions (coordinates of cells and their contents) but proper functions as well.
There should also be variables, independent of cells as well.
Variables exist to store the output of specific function calls.
Finally, besides display-formatting info, cell contents should only be able to contain one of two things: data, or a reference to a single variable.
A probable workflow under this paradigm looks like this:
- Design and place your inputs as cells in the spreadsheet, giving a name to each
- Create variables for your outputs, and place references to these variables in your output cells.
- Write the functions that will generate the outputs from the inputs, and fill in the variables with calls to these functions.
Advantage of this paradigm?
- Accidentally overwriting or editing a cell would never destroy code. The most that could be accidentally erased is a reference to a variable that would still exist in the code.
- Text-representation of the spreadsheet would actually be readable and understandable.
A somewhat opinionated example of what the code for the spreadsheet would look like (modified from Bentley’s original post above):
InputHeights = A2:A4
MeanHeights = mean(InputHeights)
Test_MeanHeights = assert(MeanHeights>1 && MeanHeights<3)

InputWeights = B2:B4
MeanWeights = mean(InputWeights)
Test_MeanWeights = assert(MeanWeights>20 && MeanWeights<150)

fit = lm(log(InputWeights)~log(InputHeights))   ove
aCalc = exp(fit$coef[1])
bCalc = exp(fit$coef[2])

MyChart = plot(InputHeights,InputWeights,xlab=label_Height,ylab=label_Weight,pch=1,cex=2)

A1 = "Height (cm)", label_Height
A2 = 1.2
A3 = 1.6
A4 = 1.9
A6 = MeanHeights
A7 = Test_MeanHeights
A9 = ""To estimate the parameters |a| and |b| of the {br} relation between weight (|w|) and height (|h|): {br} |w=ah^b| {br} a log-log linear model was fitted to the data: {br} |log(w)=i+slog(h)| {br} so that |a=e^i| and |b=e^s|""

A25 = "a"
A26 = "b"
B25 = aCalc
B26 = bCalc

B1 = "Weight (kg)", label_Weight
B2 = 34
B3 = 56
B4 = 89
B6 = MeanWeights
B7 = Test_MeanWeights

E2 = MyChart
It is more verbose than the example originally given, but we aren’t writing Perl. The software would generate this code behind the scenes and the GUI would eliminate most of the friction involved if done properly.
Another news clipping:
Washington Post: An alarming number of scientific papers contain Excel errors
The Australian researchers found that roughly 1 in 5 of these papers included errors in their gene lists that were due to Excel automatically converting gene names to things like calendar dates or random numbers.
...Even more troubling, the researchers note that there's no way to permanently disable automatic date formatting within Excel. Researchers still have to remember to manually format columns to "Text" before you type anything in new Excel sheets — every. single. time.